Why I built Lampmile
The original idea for Lampmile (the miles you walk by headlamp before first light) came from my experience attempting to summit Cotopaxi.
Here is what the models had on file for Cotopaxi that night. Full cloud from dusk until well past dawn. Light precipitation every hour, a few tenths of a millimetre, with the freezing level a couple of hundred metres below the Refugio, so it would fall as snow. Summit temperature around −10 °C. All of that came true, more or less. The snow in the clip above is going sideways, which is the part the forecast had trouble with.
The wind is where it falls apart. Ask ECMWF for the wind at the summit and it says two or three kilometres an hour, all night. Ask GFS and it says ten to fourteen. Ask either of them for the gusts and the answer is fifty to sixty. Ask what the air itself is doing at summit height, at the 500 hPa level, which that night sat within thirty metres of the summit’s own elevation, and both models agree: fifty to sixty kilometres an hour out of the east-southeast, steady from the evening through the morning.
So the same forecast says calm and says gale, depending on which number you read. That is not a bug in the models. The output I could get is on a grid of cells about twenty-five kilometres on a side; the models themselves run finer, nine kilometres for ECMWF and thirteen for GFS, but Cotopaxi fits inside a single cell at any of those sizes. The cell has one ground level, a smoothed-out average of the terrain, and one surface wind, which is what the model thinks is happening at ten metres above that average ground. The summit at 5,897 m and the Refugio at 4,864 m are the same point as far as the model is concerned. Every wind figure I pulled for the two locations was identical. Only the temperature differed, and that is a lapse-rate adjustment applied afterwards, not the model knowing anything about the mountain.
What the model does know is the free air: the jet running over the top of the smoothed cell. That was fifty to sixty all night. What it cannot tell you is what a ridge does with that. A ridge does not sit under the wind. It squeezes it, bends it, accelerates it over the crest and spills it down the lee side, and the person standing on the crest gets something closer to the free-air number than to the “surface wind” figure the app shows in large type. The gust number was the honest one. It was also the one nobody reads.
That is the gap. The forecast for the valley was fine. The forecast for the summit was the same forecast printed at the summit’s height, and it was not fine, because nothing in it knew there was a summit.
Weather data by Open-Meteo.com, archived model runs for 24 to 25 July 2026.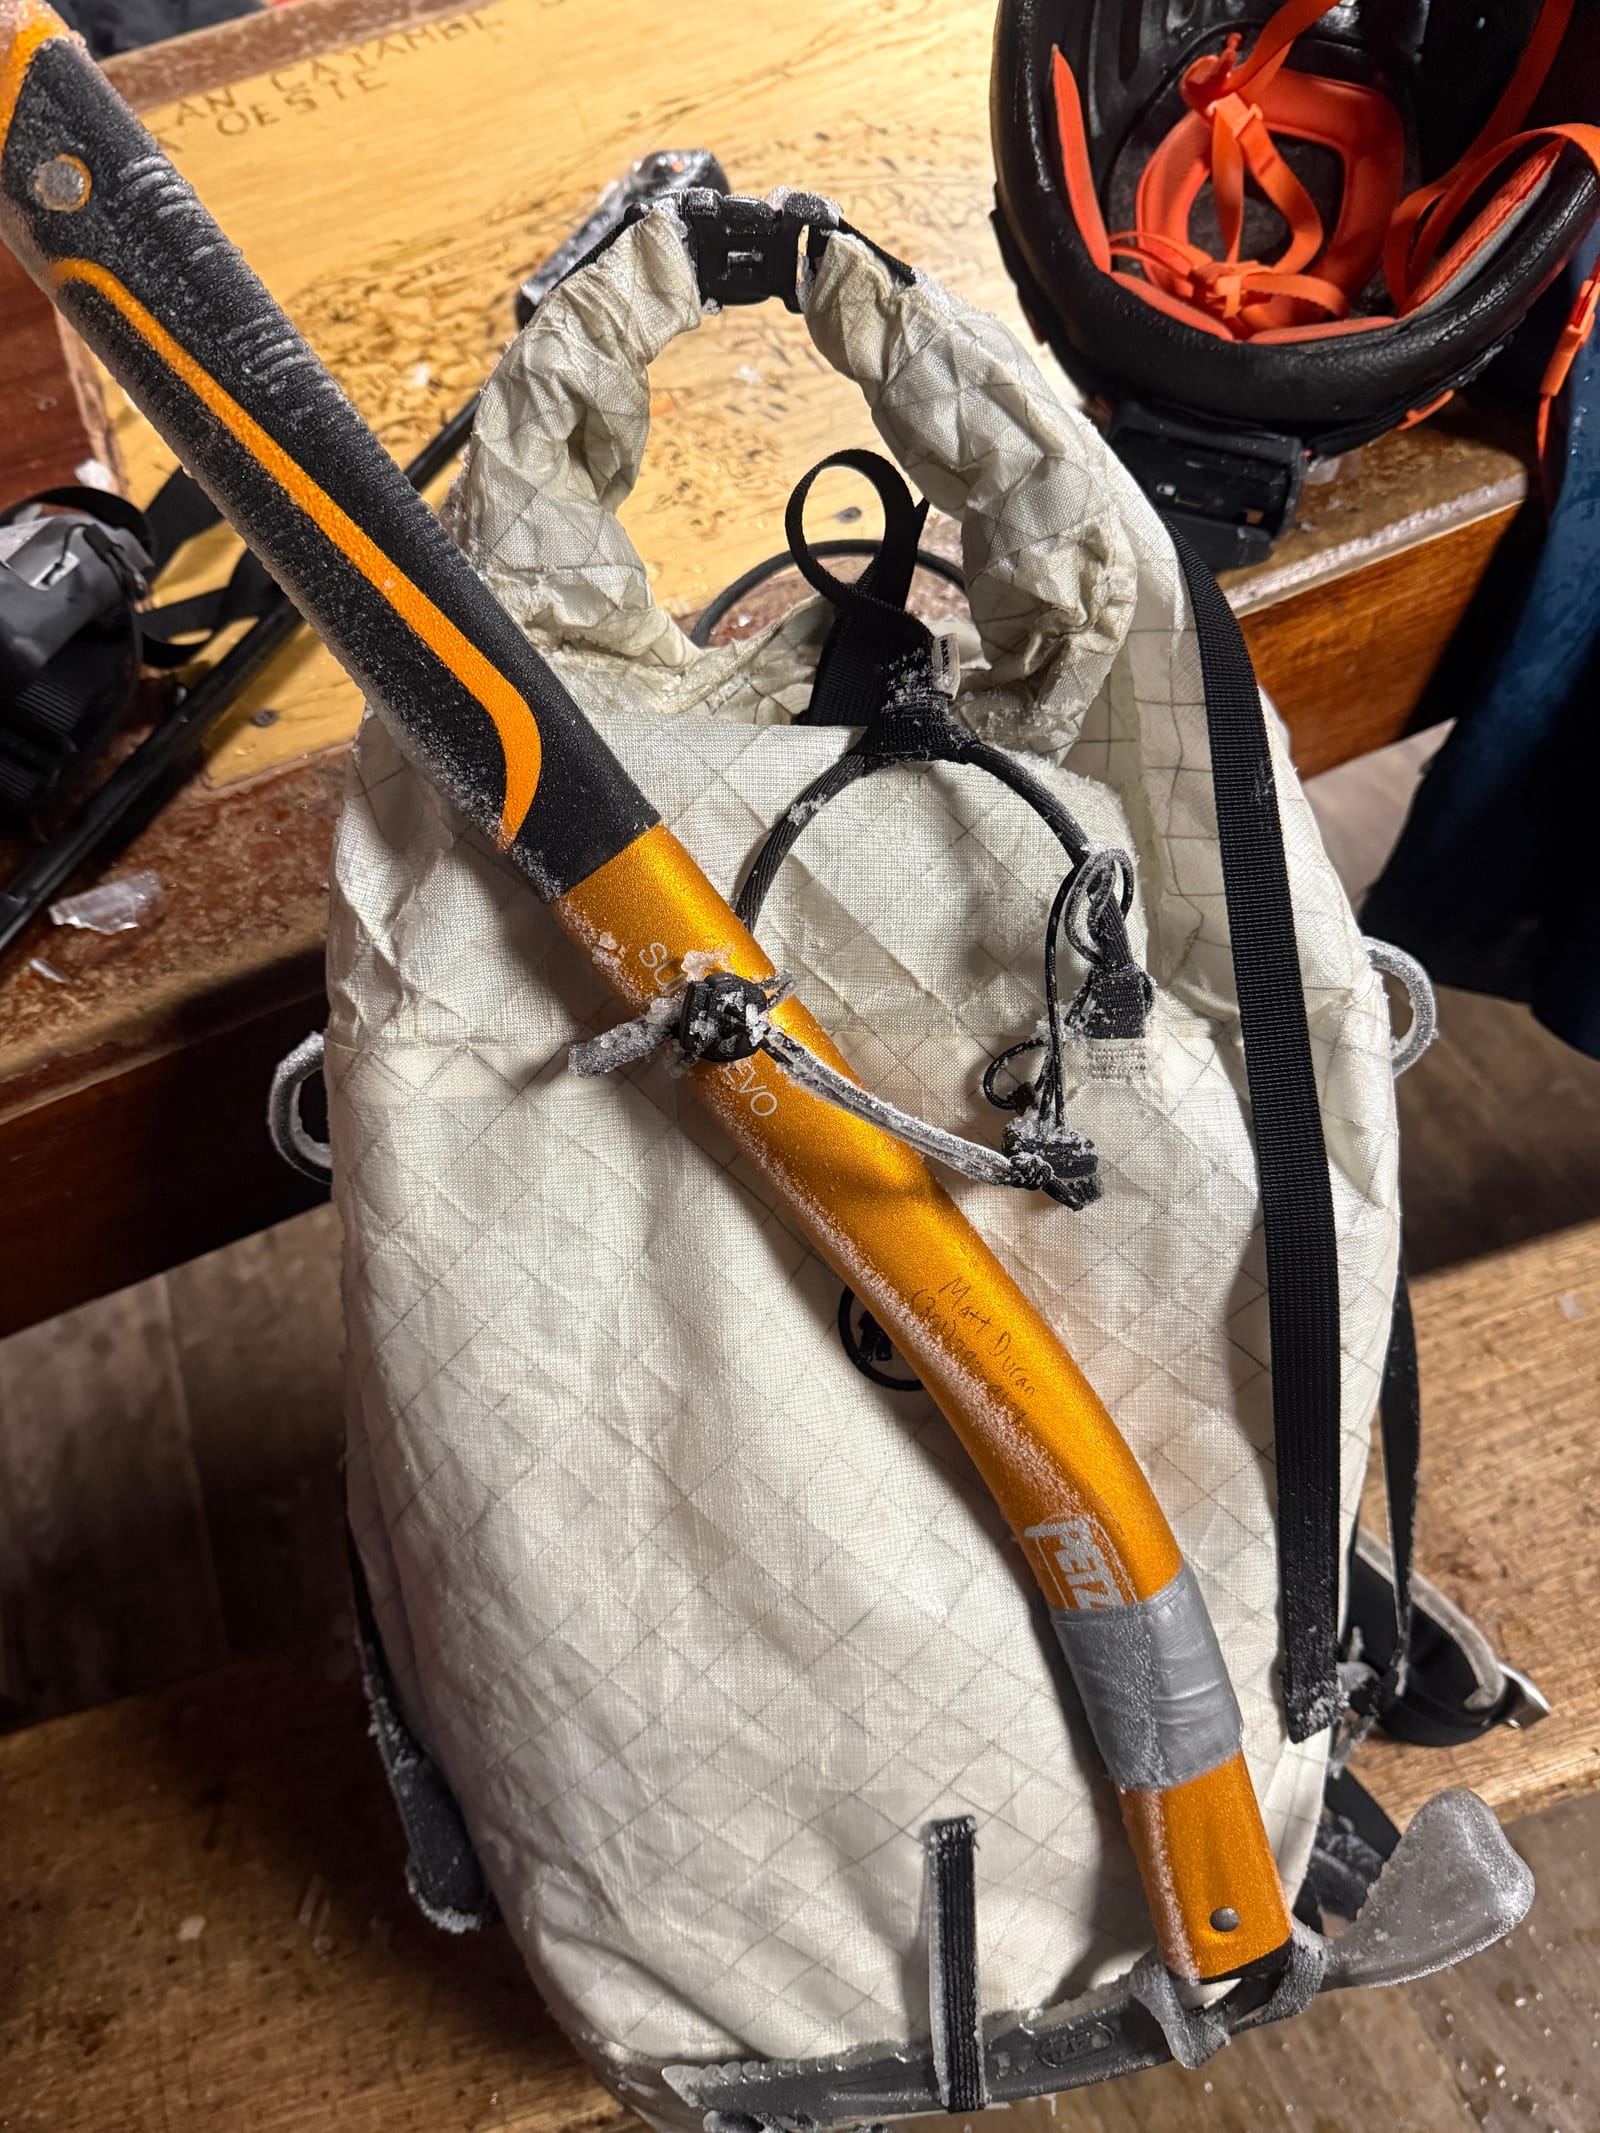
About fifteen or twenty minutes above the Refugio the temperature dropped and the visibility went with it. The sleet was coming in sideways. I had no eye protection with a clear lens: my goggles still had their category 4 lens in, the near-black glacier lens for sun on snow, which at one in the morning in a whiteout is the same as no goggles at all. We stuck with our summit attempt until we made it roughly to the foot of the glacier, where we decided to turn around as conditions kept degrading.
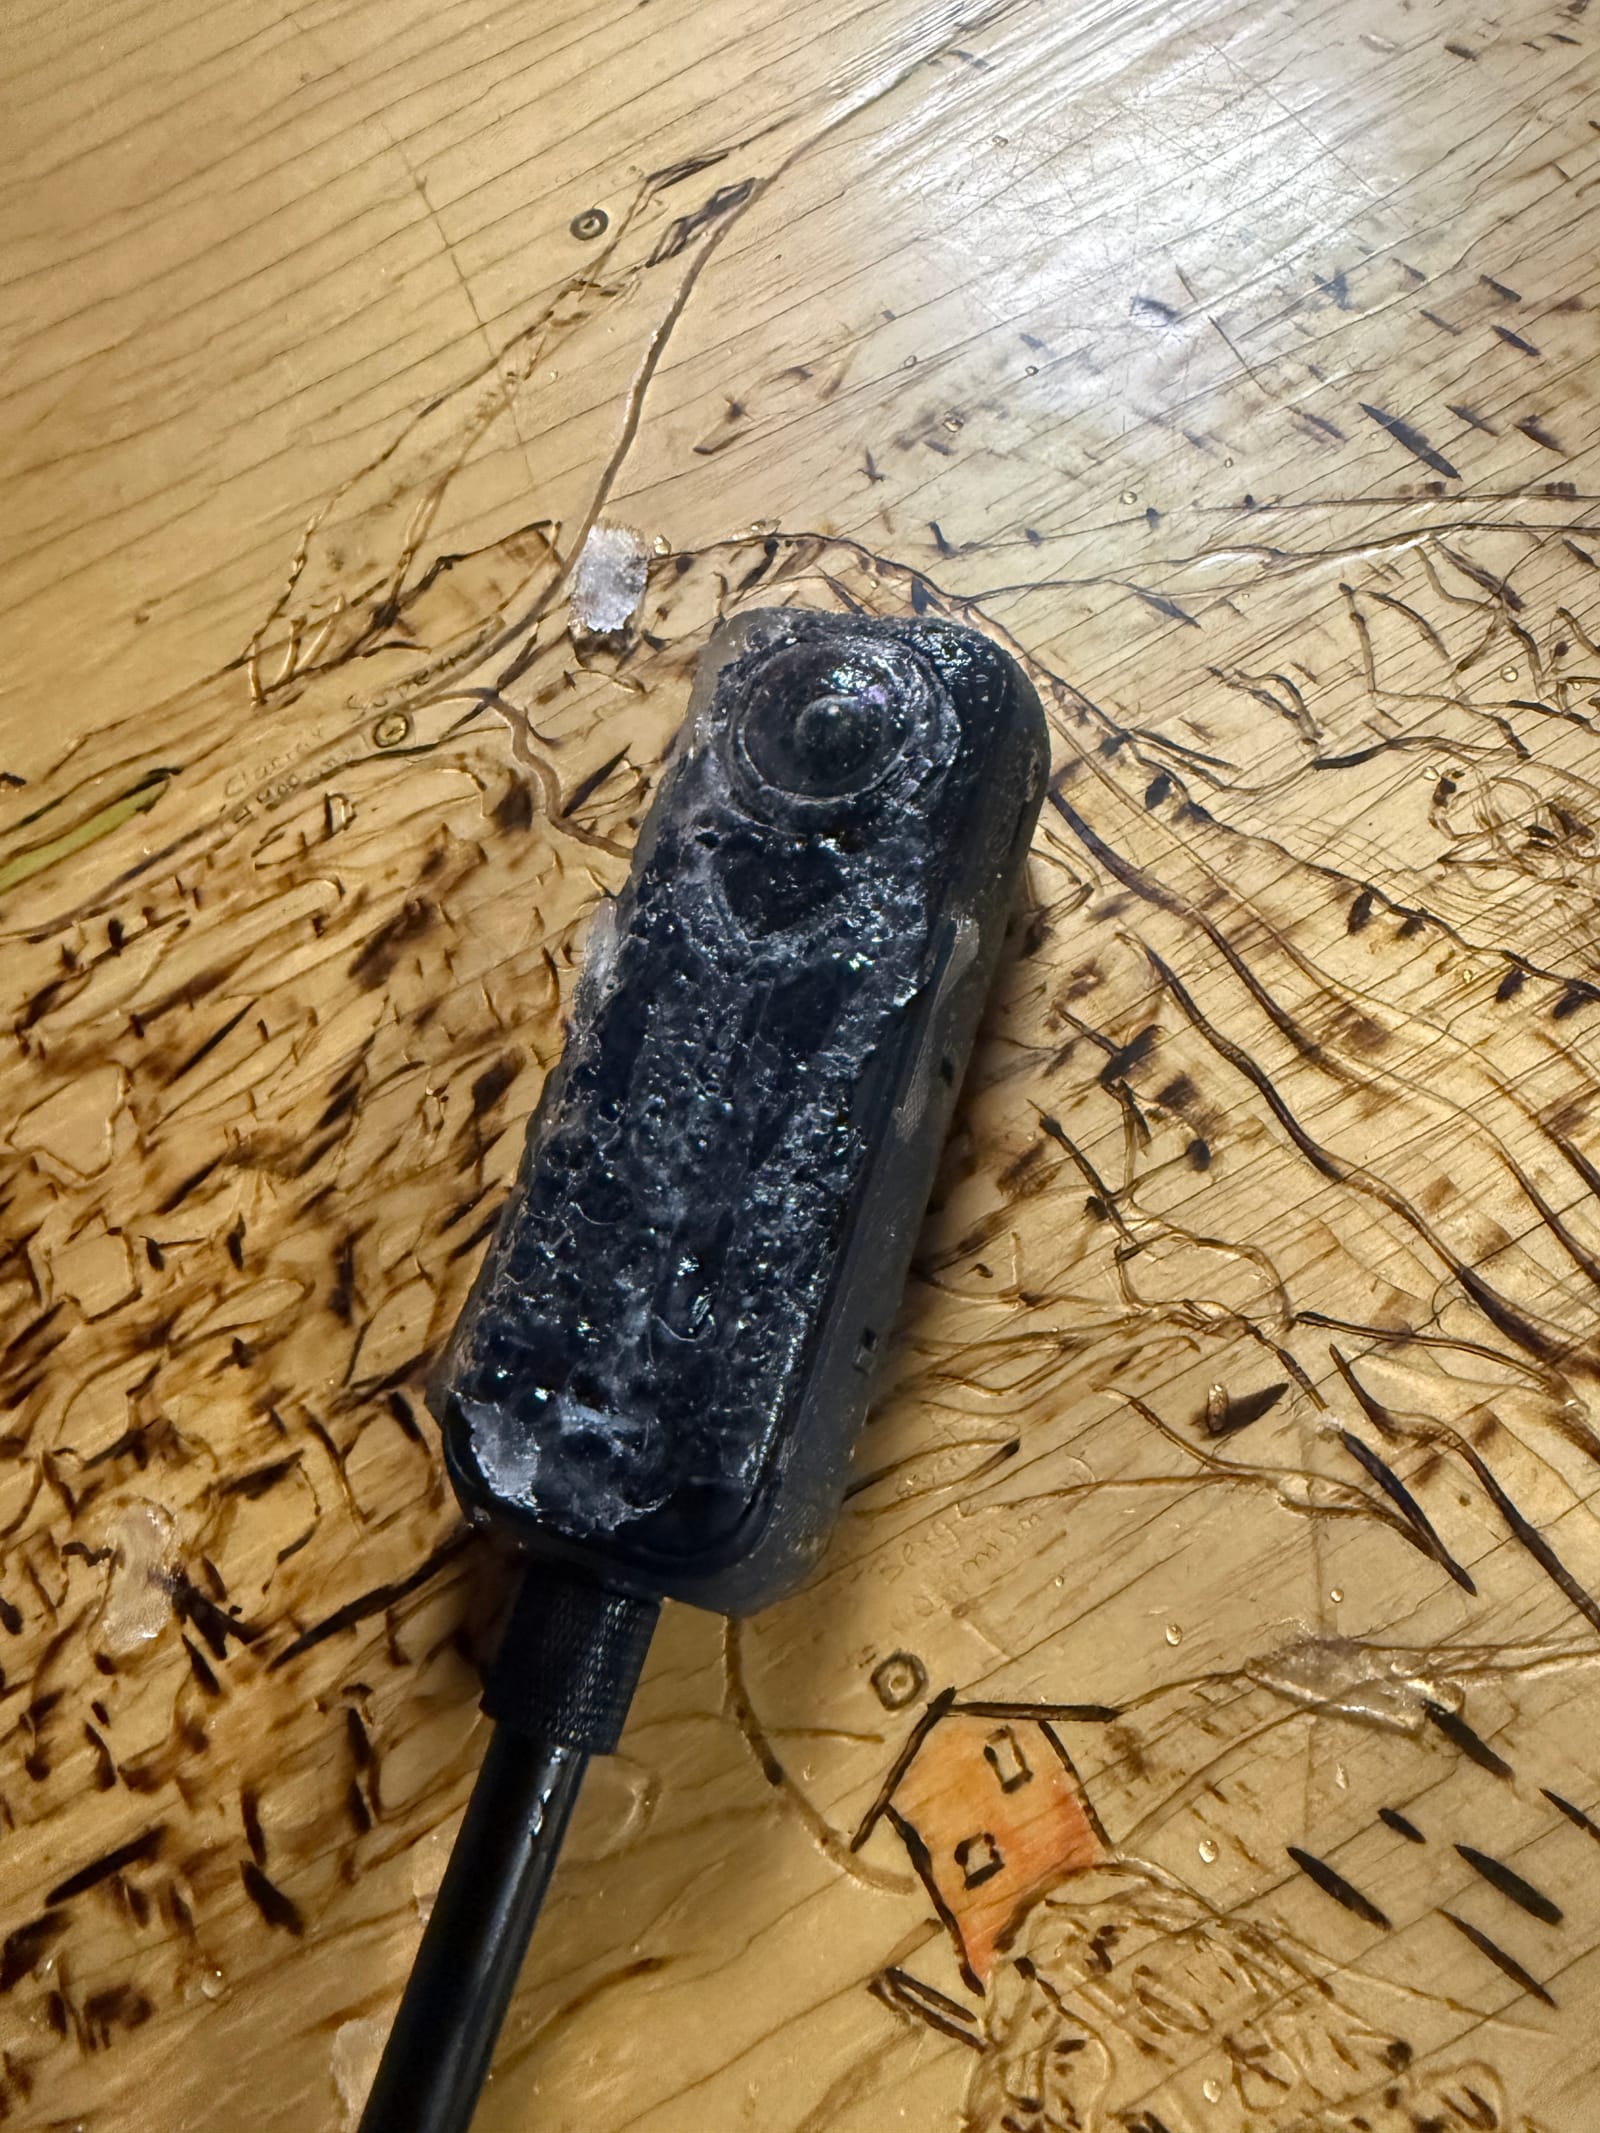
The gear tells the rest. Everything we had carried up came back rimed, and two hours later the poles were still cased in ice at the table.
What a summit forecast actually needs
A climber does not need a weather forecast. A climber needs a window: a few hours, on one day, in one band of altitude, when the wind, the visibility and the cold are all survivable at the same time. Everything about the decision is specific. You leave the Refugio at midnight or you do not. You are on the glacier at three or you are back in your bag. The forecast that would have helped that night was not “Cotopaxi, Friday: cloudy, snow showers.” It was “the summit ridge, between four and seven in the morning, this much wind.”
Of the three things that make up the window, wind is the one that matters most at the top and the one the forecast handles worst. Temperature at altitude is easy: every app already lapses the model’s number up the mountain, and it lands within a couple of degrees. Precipitation is broad; if the cell is under a wet cloud, so is the summit. But wind on a ridge is set by the ridge. It is decided by the shape of the terrain at the scale of a few hundred metres, the notch you climb through, the crest that faces the flow, the lee slope where it drops out. None of that exists inside a cell ten or twenty-five kilometres wide, and the number an app prints for the summit is the cell’s number with the summit’s name on it.
The strange part is that the models are not wrong about the weather. They had the cloud, the snow, the freezing level and the air moving over the top of Cotopaxi at fifty to sixty kilometres an hour, all of it, hours ahead. What nobody had was the last step: what that air does when it meets that mountain, on that morning, at the height where people were standing. That is the question I went home with. Not “what will the weather be,” which was answered, but “what will the wind be on the ridge I am about to climb,” which nobody was even asking.
What I was already using
None of this is a complaint about the tools I had in the Refugio. They are good at what they do. But it is worth being precise about what each one does, because the gap sits between them.
The map viewers, Windy and meteoblue among them, show you the model. That is their whole virtue: you can see the wind at any pressure level, switch between ECMWF and GFS and ICON, watch the front come through. If you know to look at the 500 hPa layer over Cotopaxi you will see the fifty to sixty that was there all night. Most people do not know to, and the point forecast you get by tapping the summit is the cell’s surface wind, which said calm.
The peak sites, mountain-forecast.com being the one every climber I know uses, take the same model and print it at several heights with the mountain’s name on it. Cotopaxi gets a forecast at 5,897 m, 5,000 m, 4,000 m and 3,000 m. That looks like a summit forecast, and for temperature it is one. For wind it is the free air at each of those heights, or the cell’s surface value, and the page does not say which, which model it came from, or how it has done. I did not save what its Cotopaxi page showed on 24 July, and the nearest copy in the Internet Archive is from June, so I cannot tell you whether it would have shown the fifty. If it did, the problem is the one I describe below: a number with no track record beside it, on a page that will not say where it came from.
The best summit forecasts anywhere are written by people. The Mount Washington Observatory publishes a higher-summits forecast twice a day from a crew who live on top of the mountain, and the avalanche centres in the Cascades and the Tetons write mountain weather forecasts every morning in season. When one of those exists for your mountain, use it. They exist for a few dozen ranges in the world, because a forecaster has to know the mountain and sit down and write it. Nobody writes one for Cotopaxi.
So the choice on the ground was a model’s cell wearing the summit’s name, or a map that would tell you the truth if you knew where to look. What I wanted was the number for the ridge, with the mountain’s shape accounted for, updated every few hours, and with its own track record printed next to it so I could decide how much to trust it. None of the tools I was using puts its own errors on the page. That last part matters more to me than the rest.
What Lampmile does
Lampmile is my attempt at an answer. You pick a mountain and it gives you the wind at the summit, hour by hour, for the days ahead: speed, gusts and direction at the top, not at the trailhead and not for a cell with the mountain’s name on it. Thirty-two peaks so far, most of them in the western United States and Colorado, plus Mount Washington, Denali, three in the Alps, and Cotopaxi and Chimborazo in Ecuador. It refreshes twice a day. You can star the ones you care about and get one email each morning with their windows, and it installs to a phone like an app so it is there when you have one bar of signal.
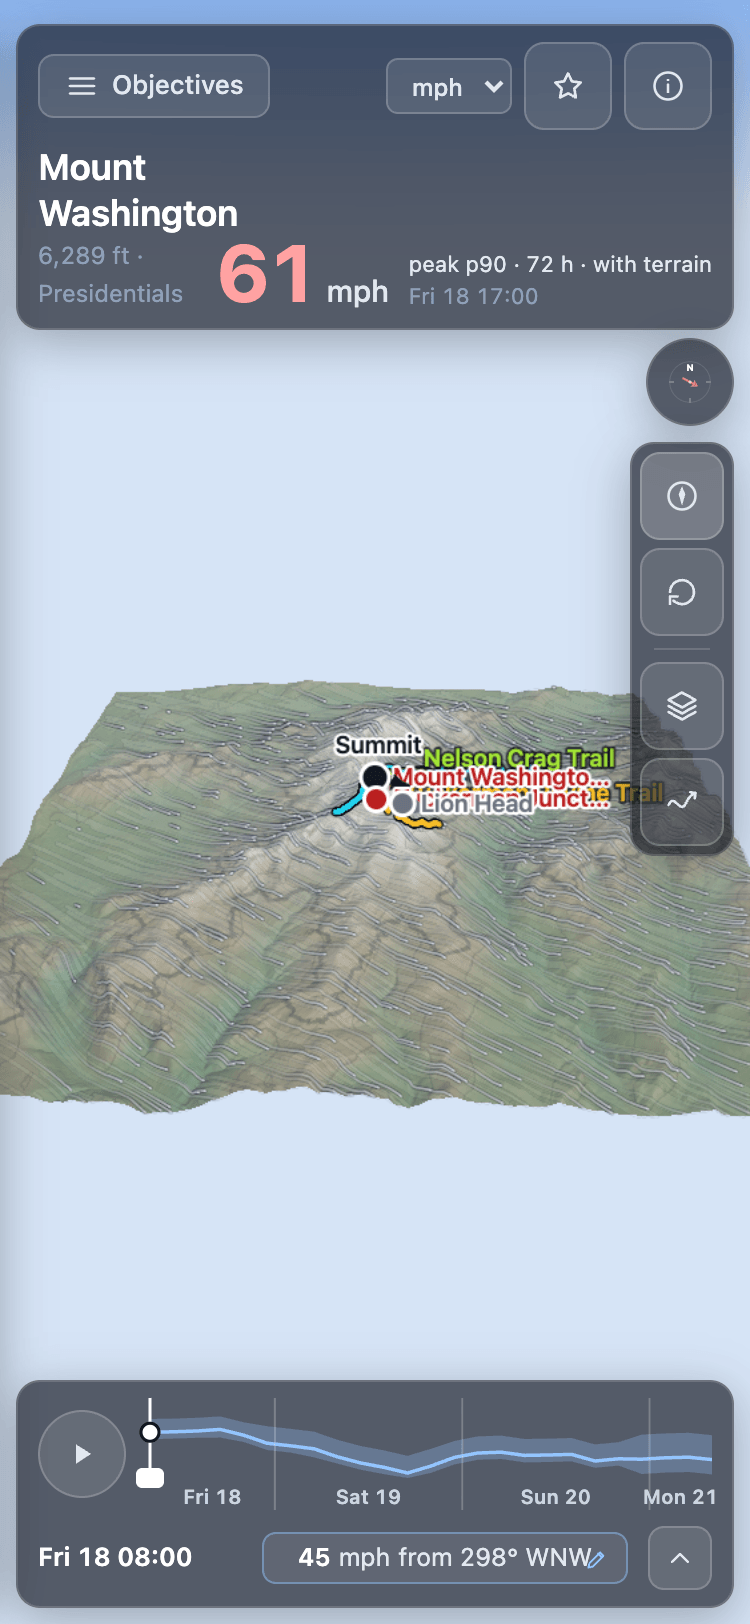
The other thing I wanted to change was how a forecast like this is read. Mountain-Forecast’s page for Rainier is a set of tables, one for each of four heights, and each table has eighteen columns, morning, afternoon and night for six days, with a wind speed and an arrow in every cell. It is dense and it is honest about what it holds. But the question on a mountain is not what the wind will be at 3,500 metres on Saturday afternoon. It is whether, between leaving camp and getting back, the wind on my route stays under what I am willing to climb in. To answer that from the tables you read a row across the days, switch to the next height and read another, hold both in your head, and guess what happens on the ridge between them, because neither the route nor the ridge is on the page.
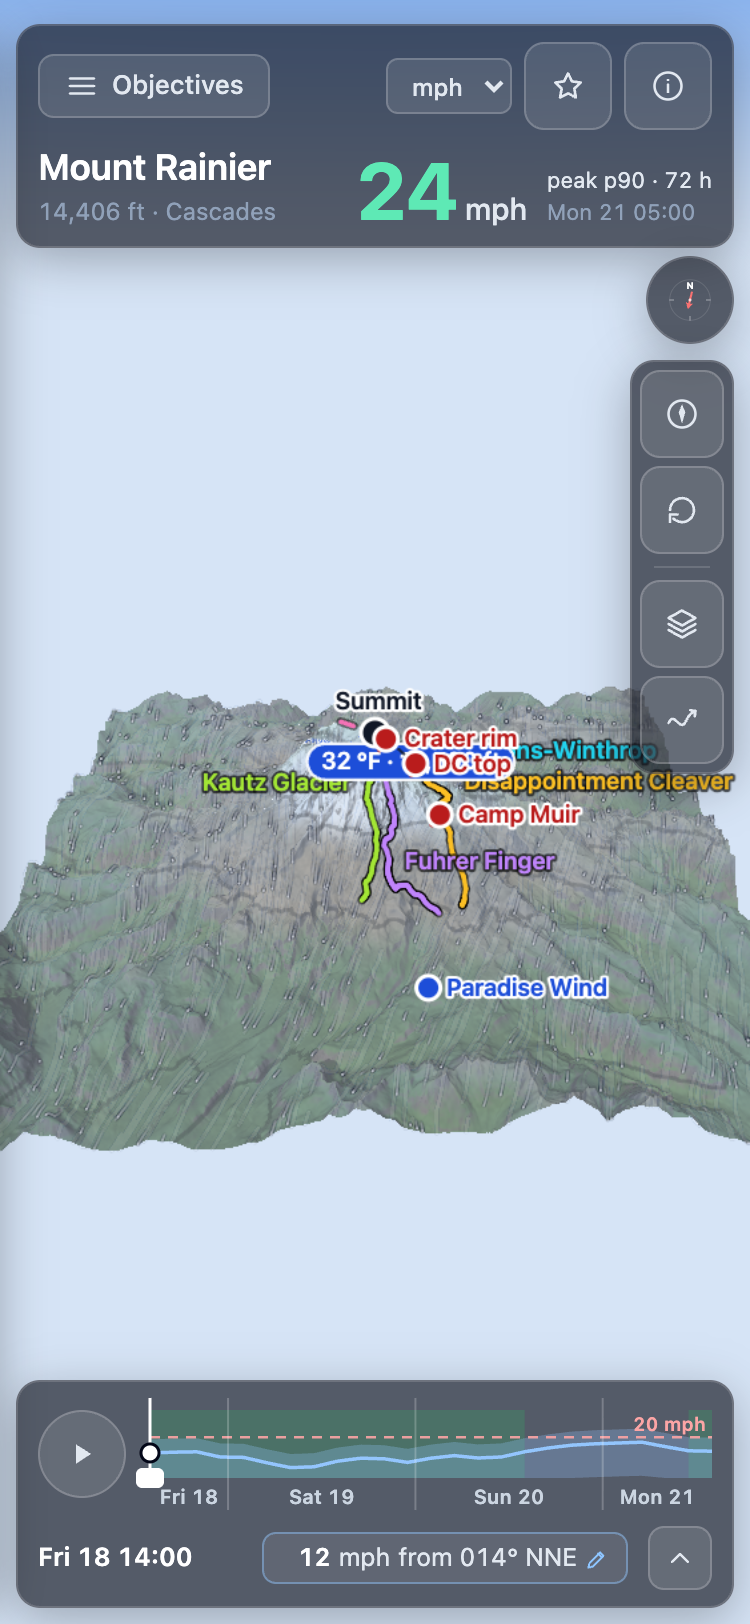
Lampmile draws the answer on the mountain instead. The terrain is there in three dimensions, coloured by the wind over it, with the climbing routes traced on and each named point carrying its own number: the summit, the crater rim, the top of the Disappointment Cleaver, Camp Muir, each marked as exposed or sheltered. The freezing level is a line across the slope. A timeline along the bottom runs through the next three days; drag it or press play and the wind moves over the mountain every three hours. Tell it the wind you would not climb above and it marks the windows, every stretch of three hours or more in which even the high end of the forecast stays under it, and lists them by day and hour. The question the tables make you assemble, the picture answers at a glance: where on the route, and when.
How it is made is not a secret, and the app’s own details sheet says as much. The numbers start where a forecaster would start: the wind in the free atmosphere at the summit’s own pressure level, read from each of four models, ECMWF’s IFS and AIFS, GFS, and HRRR where it covers the mountain. That is the fifty to sixty over Cotopaxi. Then the mountain is put back. Around each summit there is a thirty-kilometre square of real terrain at thirty metres from the Copernicus elevation model, ten metres in the United States from the USGS, and a mass-consistent wind solve pushes each model’s free-air wind over it, hour by hour, so the summit and every named point on the route reads its number from a field that knows where the ridge is. The technique is decades old and there is nothing proprietary in it; what is new is doing it for named summits twice a day, scoring the result against stations, and using that record to decide, objective by objective, whether the adjusted number or the plain free-air one goes on the page. The same solve runs on the graphics chip in your browser, which is how the app can let you turn the wind by hand and watch the field re-solve over the mountain.
The part I care most about is the line under the forecast. For ten of the thirty-two peaks there is a weather station high on the mountain, and the app scores itself against that station continuously and prints the result next to the forecast: which station, how far below the summit it sits, and how far off the forecast has been over the last month, in metres per second. Some of those numbers are good. Some are not, and they say so. A forecast for a summit that will not tell you how wrong it has been is the thing I was standing under on Cotopaxi, and I did not want to build another one.
It is a personal project, and a young one, so the honest list is short but real. It does not make the call; it gives you a number and a track record and leaves the decision where it belongs. Only one of the thirty-two, Mount Washington, has a station on the summit itself. For the rest the app shows instead how the same kind of forecast has done at six summit stations elsewhere, 2.9 m/s free-air and 2.7 adjusted over the last thirty days, and labels it inferred, not measured. Twenty-two of the thirty-two have no station high on the mountain at all, and on the other nine the station usually sits a thousand metres or more below the summit, which is a check on the mountain rather than on the summit itself. A month of scoring is a small sample. And Cotopaxi is on the list now, with Chimborazo beside it, but neither has a station anywhere near the ice: the night that started this is one the app can now forecast and still cannot check.
How wrong it has been
Here are the numbers as they stood on 21 September 2026, for the ten peaks with a station high enough to check against. The miss is the average size of the error, in metres per second, for the forecast issued twelve to twenty-four hours ahead, scored against the station’s hourly readings over the previous thirty days; the lean is which way it tends to be wrong, in the same unit. The last column is the baseline: what the model’s own 10 m wind for the cell the station sits in would have scored at the same station over the same hours, from the run a day earlier. I scored ECMWF and GFS both and show whichever did better at each station, chosen with hindsight, which is the harder version of the test. One metre per second is about 3.6 km/h, or 2.2 mph.
| Peak | Station | Below summit, m | Miss, m/s | Lean | Cell, m/s |
|---|---|---|---|---|---|
| Matterhorn | Gornergrat | 1,349 | 1.0 | +0.1 | 1.1 |
| Mount Baker | Pan Dome, Mt Baker Ski Area | 1,756 | 1.3 | −0.8 | 1.1 |
| Jungfrau | Jungfraujoch | 587 | 2.0 | −0.5 | 3.5 |
| Mount Whitney | Rattlesnake RAWS | 1,800 | 2.1 | −0.8 | 1.3 |
| Grand Teton | Rendezvous summit, Jackson Hole | 1,051 | 2.2 | +1.6 | 2.3 |
| Mount Shasta | Grey Butte | 1,896 | 2.4 | −0.5 | 1.7 |
| Mount Hood | Cascade Express, Mt Hood Meadows | 1,204 | 2.6 | +2.4 | 1.4 |
| Mount Rainier | Camp Muir | 1,309 | 3.1 | +2.7 | 1.5 |
| Denali | 14,200 ft camp | 1,862 | 4.2 | +3.3 | 3.0 |
| Mount Washington | Observatory summit | 0 | 6.1 | −5.8 | 10.9 |
Read the last two columns together, because they change what the table means. Against the best raw cell, Lampmile wins at four stations and loses at six. Where it wins is telling: the one station that stands on a summit, Mount Washington, where the cell says 10.9 and the forecast says 6.1; and the two Alpine stations that sit highest on their mountains, Jungfraujoch and Gornergrat. Where it loses, it loses to the surface wind at stations a kilometre or more below the top on a sheltered slope: Camp Muir, the Hood Meadows lift, the Denali camp. That is the pattern you would expect if the forecast is a summit number. A sheltered anemometer far below the summit is measuring a different wind, and the model’s own surface value for that cell describes it better than a forecast for the ridge above does. The miss in those rows is the mismatch as much as the forecast, and the leans say so: Rainier and Hood are wrong by about the same amount in the same direction every hour, too strong, which is what a summit wind looks like from a sheltered slope.
The other baseline is persistence, yesterday’s reading at the same hour, the laziest forecast there is. It scores between 1.2 and 10.1 across these stations and beats Lampmile at four of the ten, all of them sheltered. At the summit station it scores 10.1 against the forecast’s 6.1. One more column belongs here, and it is the one the app now leads with. The Miss column is the plain free-air forecast. The app’s badge now leads with whichever series the page shows, so at Mount Washington it reads the adjusted 3.2 and names the 6.1 beside it. The terrain-adjusted series, the one that has been the headline since mid-September wherever it verified better, scores 3.2 at Mount Washington against that 6.1, and 3.4 at the Denali camp against 4.2. It is a wash at Baker, Gornergrat, Camp Muir and Grey Butte, and worse at Hood Meadows and Jungfraujoch, which is why the app chooses per objective rather than switching everywhere. So the honest claim is narrow, and I will make it narrowly: at the one place where a summit forecast can be checked against a summit, this one beats both the raw model cell and yesterday’s weather by a wide margin, and it is still six metres per second too weak. Everywhere below the summit the table is mostly measuring how far the station is from the thing being forecast. These thirty days are also late summer, the calmest part of the year in the Cascades, the Sierra and the Alps, with between 148 and 197 station hours per row; winter will be harder on every column.
The observations come from the station networks named in each row: the Northwest Avalanche Center, the Mount Shasta Avalanche Center, MeteoSwiss, the Bridger-Teton Avalanche Center, the National Park Service, and the Mount Washington Observatory.